If you’ve ever had a Ladybird moment and wanted to pay your parents back for raising you, this new map from Opploans might make the task a lot easier. Opploans, an online installment loans website, shows the average amount of money parents from each state spend each year per child. As any parent will tell you, having kids isn’t cheap these days. With everything from food to medical care getting more expensive by the year, many parents might not even want to know how much money their children actually necessitate, especially if they live in the Northeastern United States.


This Map Shows How Much Parents Spend on Their Kids in Every State
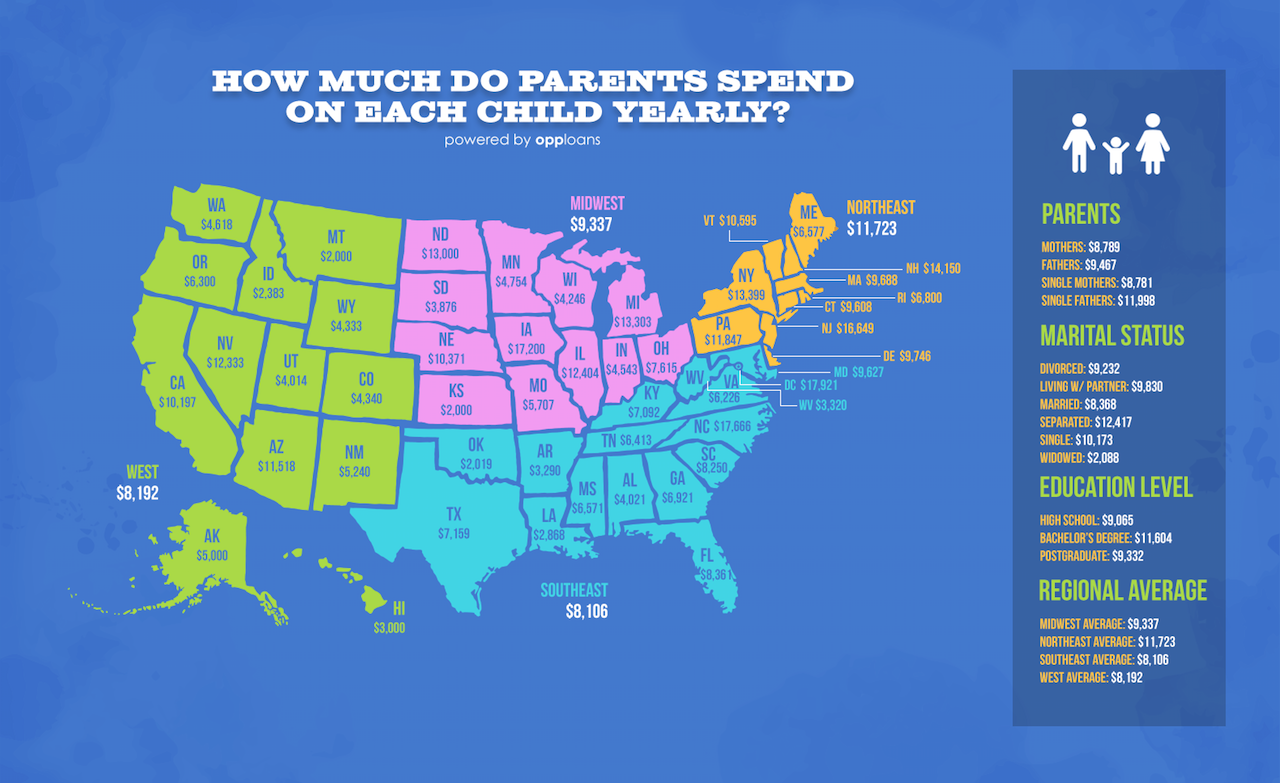
The differences in costs between the states are striking. Parents in Washington, D.C. ($17,921 per year) and North Carolina ($17,666 per year) spend the most, while Montanans and Kansans ($2,000 per year) were far lower than any other state, followed closely by Oklahoma ($2,019 per year), Idaho ($2,383 per year) and Louisiana ($2,868).

Photo: Opp Loans
The map also broke the United States down into four sections — West, Midwest, Southeast, and Northeast, and averaged the dollar amounts from the states in each section to create a section average. With an average spend of $11,723, the Northeast spends significantly more money per child each year than anywhere else in the country. The Southeastern states brought up the rear at just $8,106 spent per child. If it weren’t for the loose-walleted parents in North Carolina and Washington, D.C., this number would have been significantly lower, as no other state even topped the $9,000 mark.
Economic status and education levels certainly play a role, as the map demonstrates. Parents who are separated are likely to spend the most money on their children, averaging $12,417, versus widowed parents who spend only $2,088 per year. Fathers tend to spend slightly more than mothers, particularly if they are single, according to the study.