Photos: author

Travel Photography Tip: Introduction to the Histogram

Travel
by Kate Siobhan Mulligan Jan 23, 2013
This article complements lessons from the MatadorU Travel Photography program.

Let’s say you’ve got a good grasp of exposure. Maybe you’re even mastering exposure locking or the exposure triangle. Or maybe you’ve been doing that for a while, but sometimes return home from a shoot to find shots that looked great in camera are dull, lifeless, underexposed, overexposed, or overall just…blah?

It’s time for two things: One, stop trusting your LCD, and two, enter the histogram.

Getting started

One of the greatest tools of the digital age of photography is the histogram, a graph that displays vital information your sensor just gathered for you. This graph should become one of your best friends.

First, turn it on. (Every camera is a little different, so consult your manual.) Instead of reviewing your image, you want the camera to show you the histogram (or an option for a histogram with a thumbnail of the image). If you don’t want it permanently on, you can probably “scroll” through various information panes on your review screen — usually by hitting an “info” button or similar — one pane of which will be your histogram.

Now when you take a picture, you’ll see a small graph that can tell you a lot more than just looking at it on your screen. The graph has roughly 5 sections. From left to right, it goes:

Very Black > Black > Midtones > White > Very White

A midtone is what the camera determines is neutral, close to 18% grey. The information collected from your sensor translates the number of pixels collected in each section. A well-exposed image will have information that sprawls across the whole graph. When you have a good range of blacks and white, you will have a lot of contrast, pop, and tonal value to your work. Alternatively, your histogram can tell you quickly if anything is “off” in the picture, exposure-wise.

What you’re seeing

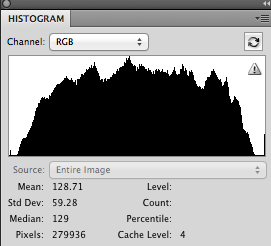
A basic, “correctly exposed” image will result in a “mountain” effect, peaking in midtones and petering off fairly equally towards dark and light.

The higher the graph is, the more pixels are recorded in that tone. This is why a correctly exposed image “should” peak in the midtones — which translates to the most detail (most recorded pixels), smooth transitions between blacks and whites, and no extreme blacks (shadows with no detail) or blown out highlights (whites with no detail). It’s what we call a “balanced” shot.

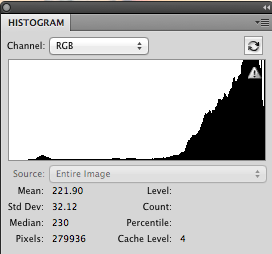
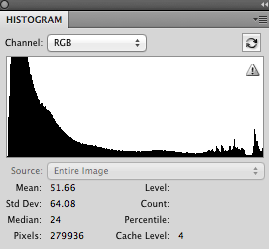
But this graph can look a lot of different ways, and there’s no one right histogram, assuming you’re aware of what you’re doing. For example, a night shot will of course push the graph almost all the way left, while a white scene, say of snow, will bunch all the way to the right; meanwhile, a picture of a sunset with a silhouette will result in peaks both in Very Black and in Very White, as below:

How and why to use it

There are exceptions to every rule with histograms. However, there are many situations when looking at your histogram and noticing red flags will help you make corrections, before you get home and realize something was off. First, learn to look at it, and understand it. The more you do that, the more you’ll be able to tell “special” circumstances from a bad exposure.

The following are different histogram situations and how to deal with each one.

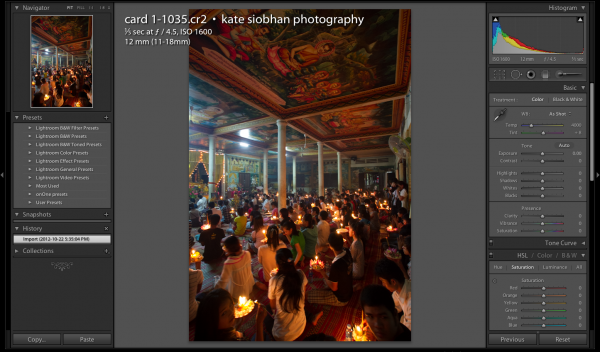
This was taken pre-dawn at a Cambodian temple. My histogram was all the way to the left, telling me I had a lot of black going on, usually meaning under-exposed. However, I wanted the bare light of the candles, so this histogram was okay by me. This image is SOOC (straight out of the camera).

1. Histogram is: Bunched left

    Problem: Your image is likely under-exposed. You may have metered off of something very bright, perhaps the sun or a reflection, causing the sensor to think the scene is bright overall. This is a dark image, but not clipped (see below).

    Solution: Try again metering off a midtone, or (if you’re in Manual) boost your settings up one or two stops (either lower your shutter speed or open your aperture — or if you can’t do either, boost your ISO).

    Some exceptions: Night scenes, star trails, and black cats sitting on black couches (or similar).

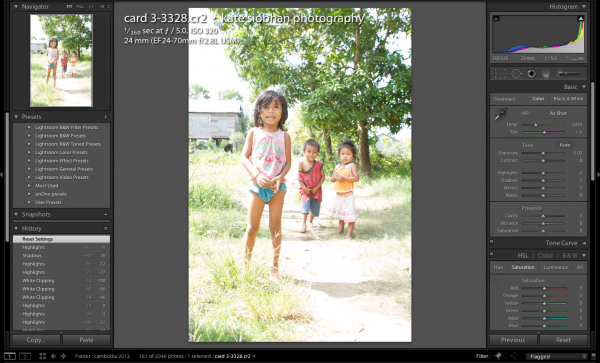
Right before this shot, I had been photographing a family sitting under their porch (see photo below). I’d metered off of a man’s face in the shade and selected my settings based on that. After showing him the photo, I walked away, only to see a trail of children following me. I snapped this shot and when the histogram popped up, I knew right away I hadn’t adjusted my settings, and they were way off. It was corrected by boosting my shutter speed. The light was so harsh, I likely wouldn’t have really been able to see the photo well on my LCD screen – but I could read my histogram easily. SOOC.

2. Histogram is: Bunched right

    Problem: Your image is likely over-exposed. You may have metered off something dark, causing the sensor to think the entire scene is dark and over-compensate. Or, you may have left your ISO on a high setting from another shoot. This is a bright image, but not clipped (see below).

    Solution: Try metering off something bright, white, or midtone, or (if you’re in Manual) drop your settings one or two stops (either increase your shutter speed, narrow your aperture — or if your ISO is on AUTO, or accidentally set high, lower it).

    Some exceptions: Snow, beaches, white buildings, high-key style, etc.

3. Histogram is: Spiked at either end

    Problem: Clipping. Clipping is when the whites in your image are pure white with no detail; that is, the white is so white that it falls outside of the scale of the histogram. This also happens with blacks, when they become so black they have no detail, and fall outside of the histogram. This results in “spikes” at either end of the histogram. I mentioned above that there are times that will call for non-traditional looking histograms, but almost never do you want spikes at the end that reveal clipping, because that detail cannot be retrieved later.

    Solution: If the spike is at one end, adjust your settings fairly drastically until it’s moved in a bit from the edge. Expose for the brightest part of the image, and then maybe even under-expose slightly more and see if it helps.

    Some exceptions: Any image with an extreme black or extreme white might clip. The problem isn’t over- or under-exposing for creative purposes — the problem is the total lack of detail in those areas. Bright or dark images are one thing, but pure black and pure white are another.

    Tip: Somewhere in your camera’s menu is a setting called “Highlight Alert” or something similar. When you look at the image on your screen, blown out highlights will blink at you as a warning.

4. Histogram is: Spiked at both ends

    Problem: The image has both pure blacks and pure whites. Not super common, but can happen.

    Solution: Consider what you’re shooting. What is causing such extremes? If it’s an extreme sort of situation (lighting wise), there may not be much you can do. It’s best to caution on the side of under-exposure, as that’s easier to retrieve detail from, rather than over-expose. That being said, shoot both and compare later — a good rule anyway.

    Exceptions: This type of histogram is unique enough that there may well be lots of exceptions. It could be a bright light in an otherwise dark room; could be midday with a lot of shadows and light; could be a silhouette or backlit shot.

How to tell your shot is correctly exposed using a histogram

1. Mountain

The mountain is the easiest way to tell if your shot is well exposed. Easily attained in morning light, sunset light, or in bright shade.

2. High levels = More pixel detail

If your levels are high, lots of pixels are getting recorded.

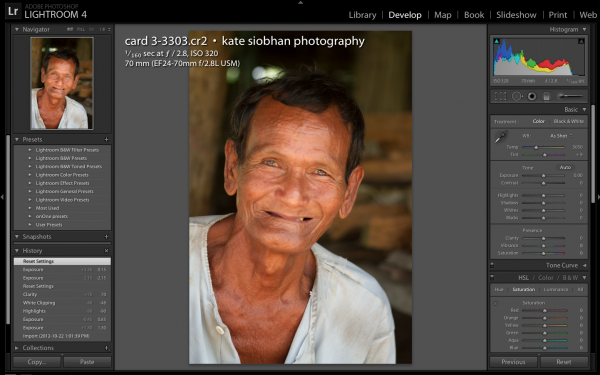
This image leans more left, because there are dark shadows behind him. However, when I saw this on my histogram, I knew it was better to be technically under-exposed, and capture all the detail in his face, than to adjust for the shadows and potentially over-expose, losing detail completely. SOOC.

3. Overall balance

If you don’t have a mountain, you can still have a complex but accurate exposure assuming the histogram is fairly balanced across the chart.

4. No clipping

Clipping is hard to fix. If you can avoid it, you’ll have a better exposure for it.

5. Not bunched together

For a nice tonal spread, aim to have information gathering from black all the way to white. If you have no black, or no whites, the image will be a bit (or a lot) “off.”

All this said, shots with odd-looking histograms may be just what you’re going for. No matter how brilliant cameras get, you make the decisions at the end of the day. Bottom line: Forget the LCD and start reading your histogram. You won’t regret it.

Keep learning! Check out the curriculum for the MatadorU Travel Photography program.

Discover Matador