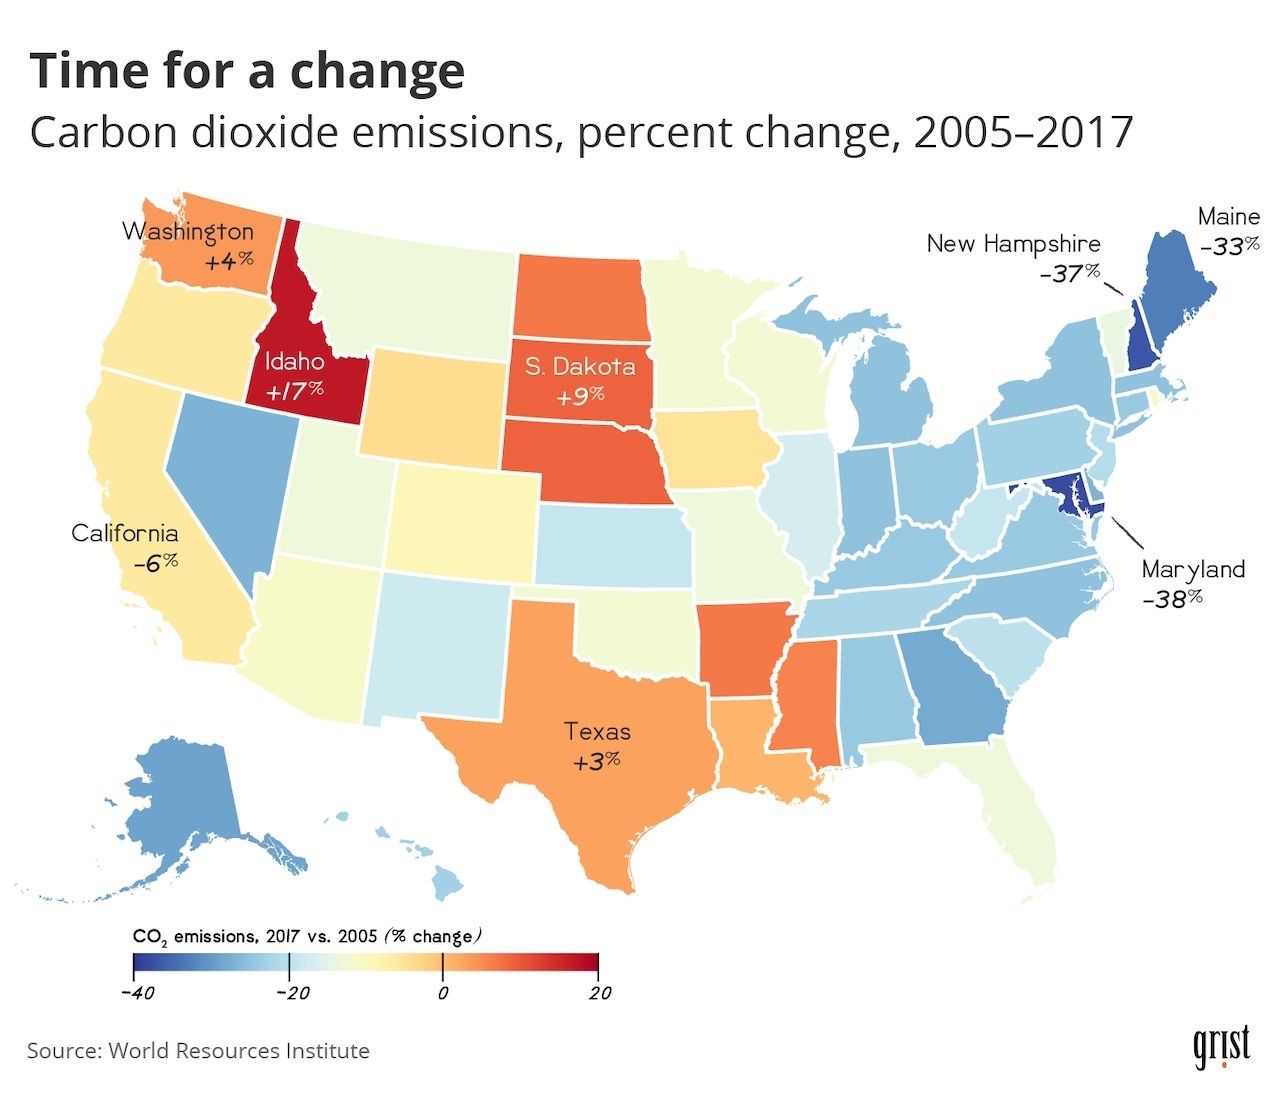
Not a day goes by without news of environmental degradation across the United States and the world. But, as Matador Network frequently reports, it’s not all bad news out there. The World Resources Institute recently released data from a study on the economic benefits of climate policy in the US, analyzing the change in each state’s emission levels. Between 2005 and 2017, 41 of the 50 states cut their emission levels, some quite drastically. Environmental publication Grist compiled an infographic based on the report, putting each state’s emissions reductions action into detail.

Which States Have Lowered Carbon Emissions Since 2005, Mapped

Photo: Clayton Aldern/Grist
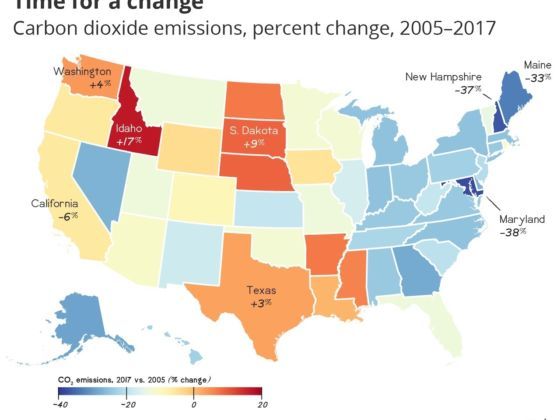
Of the five most populated states in the nation, only New York and Pennsylvania achieved emissions reductions greater than 20 percent. Maryland leads the entire country, dropping emissions by 38 percent during the survey period. Other notable achievers include Maine, at 33 percent, and New Hampshire, at 37 percent. On the whole, the entire Northeast, save for Rhode Island and Vermont, is leading the national charge.
But it’s not all rosy out there. Several states have actually seen carbon dioxide emissions increase since 2005. The largest of these is Texas, which saw a 3 percent increase. Washington, which has proposed one of the most far-reaching climate plans under Governor Jay Inslee, is guilty of a 4 percent increase in emissions. But it’s their neighbor Idaho that has driven at full speed in the wrong direction — emissions increased 17 percent between 2005 and 2017.
While the US still has much work to do to cut carbon dioxide emissions and promote renewable energy, the fact that so many states have managed to cut emissions without much federal oversight serves as a light of encouragement in an era of dark news. Here’s to hoping we can push the needle forward.