THE PLEASANT SENSATION we feel walking through an urban area with lots of trees in a hot summer day is called “mitigation of extreme temperatures” by scientists. Trees help create “microclimates” because they block radiation and increase the evaporation of water. Trees also also absorb water during storms and reduce air pollution and noise caused by city traffic. Some studies show that greenery is good for our mental health as well. So, yeah, trees are pretty awesome to have around and that’s why some of us care about “mapping trees”.
Source: Treepedia
Researchers Are Mapping Trees in US Cities. The Results Are Surprising and Beautiful
Researchers at MIT Senseable City Lab, in collaboration with the World Economic Forum, have created a project and platform known as “Treepedia”. The ultimate purpose is not only to enable scientists and city dwellers to monitor vegetation in cities, but also to help people take action to improve tree coverage. In the future, users will have the possibility to add unique tree information on an open-source street map and engage with city officials in order to request that new trees be planted in certain areas.
For now, Treepedia has released some interesting maps that allow us to compare different areas in a city, and to compare different cities around the world. For example, take a look at these two close-up of New York City below: a spot at Bryant Park and a spot near the Rockefeller Center. There is a pretty big difference…
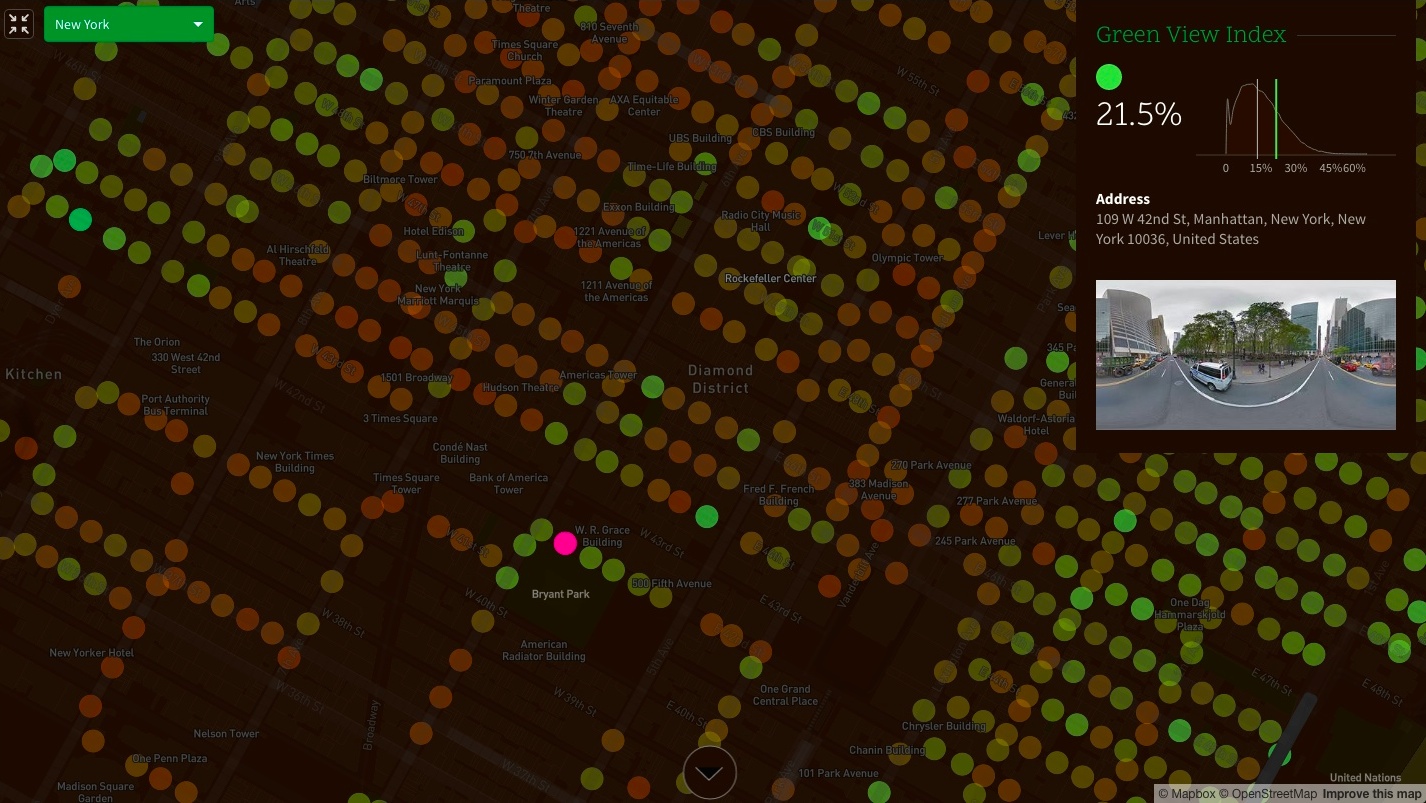
Spot at Bryant Park. Source: Treepedia
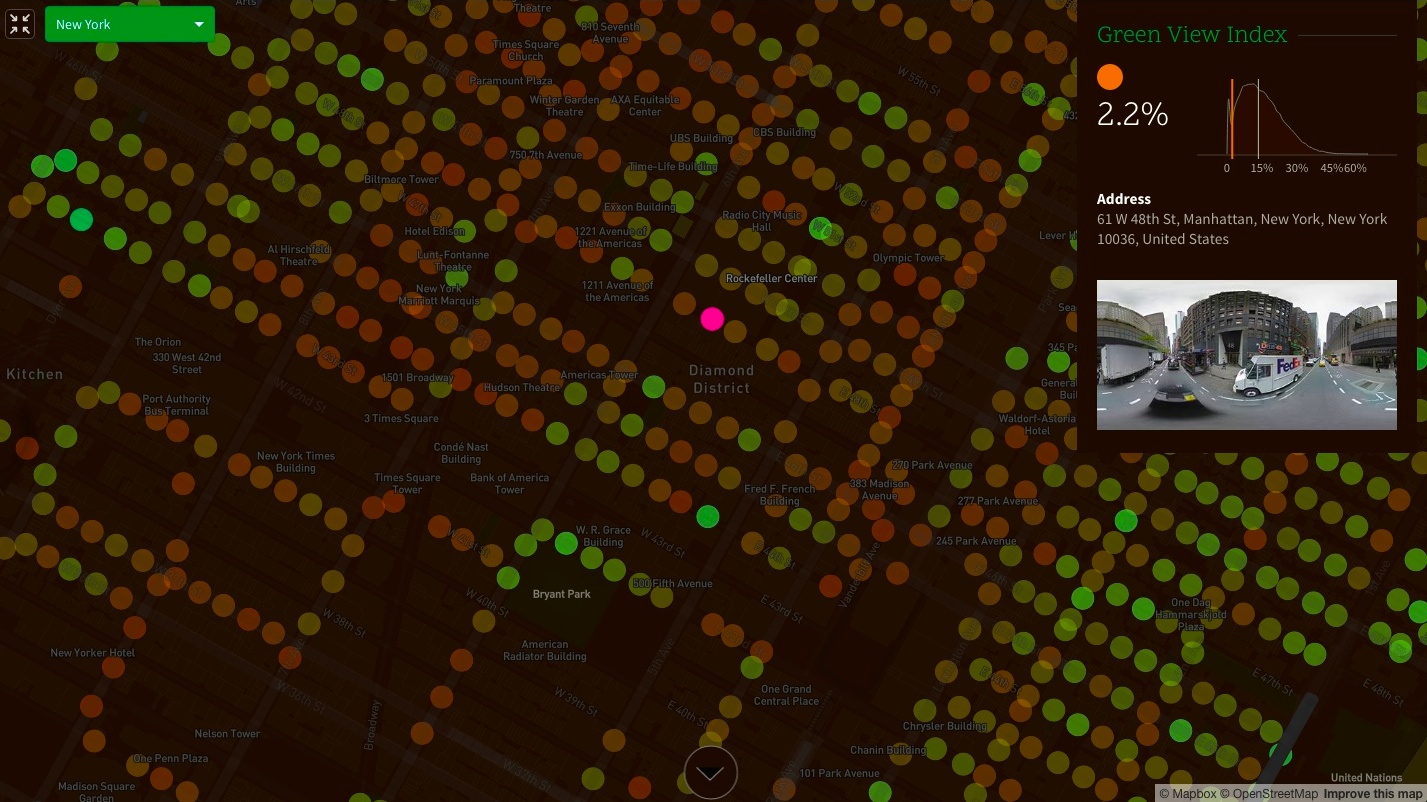
Spot close to the Rockefeller Center. Source: Treepedia
Instead of using images from a satellite, the researchers are using Google Street View (GSV) panoramas to measure the “canopy cover” or portion of trees and vegetation aboveground. This way, they are able to represent in maps how green we perceive the streets of a city. When we navigate the maps, zooming in and out, the greener the dots, the larger the presence of trees and vegetation. Otherwise, the dots look brownish. The researchers came up with a “Green View Index”, a measure to compare how green neighbourhoods and cities are.
Source: Treepedia
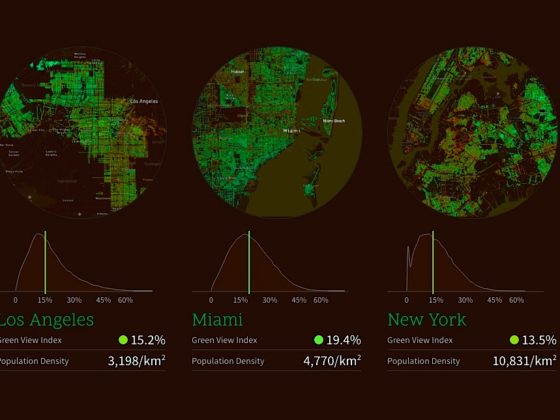
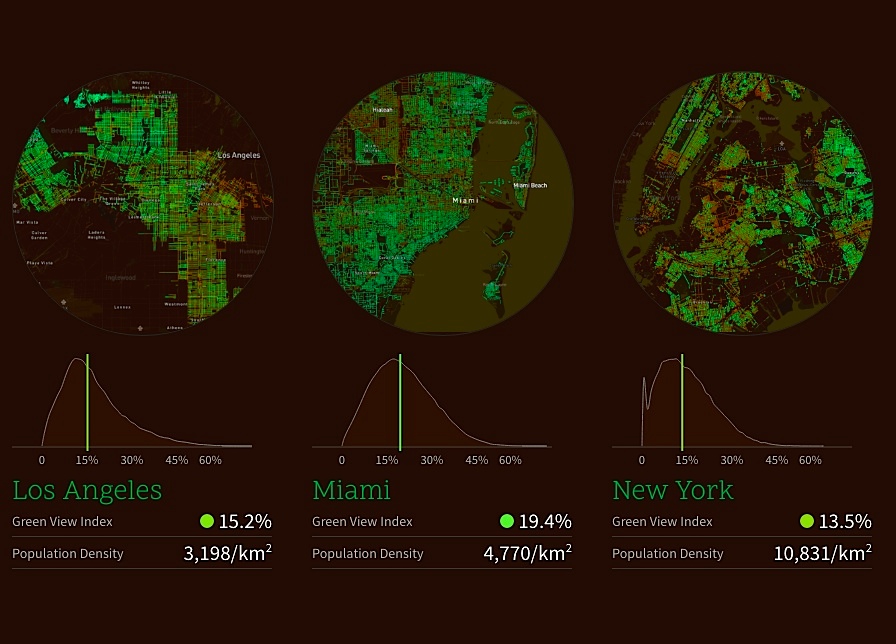
Considering the cities already included in Treepedia, the greenest US city is Sacramento, with a Green View Index of 23.6%. New York City, on the other hand, only reaches an average of 13.6% Green View Index. One could think that NYC owes that to being so packed… However, even if population density is three times larger in NYC than in LA, the Green View Index is similar in both cases.
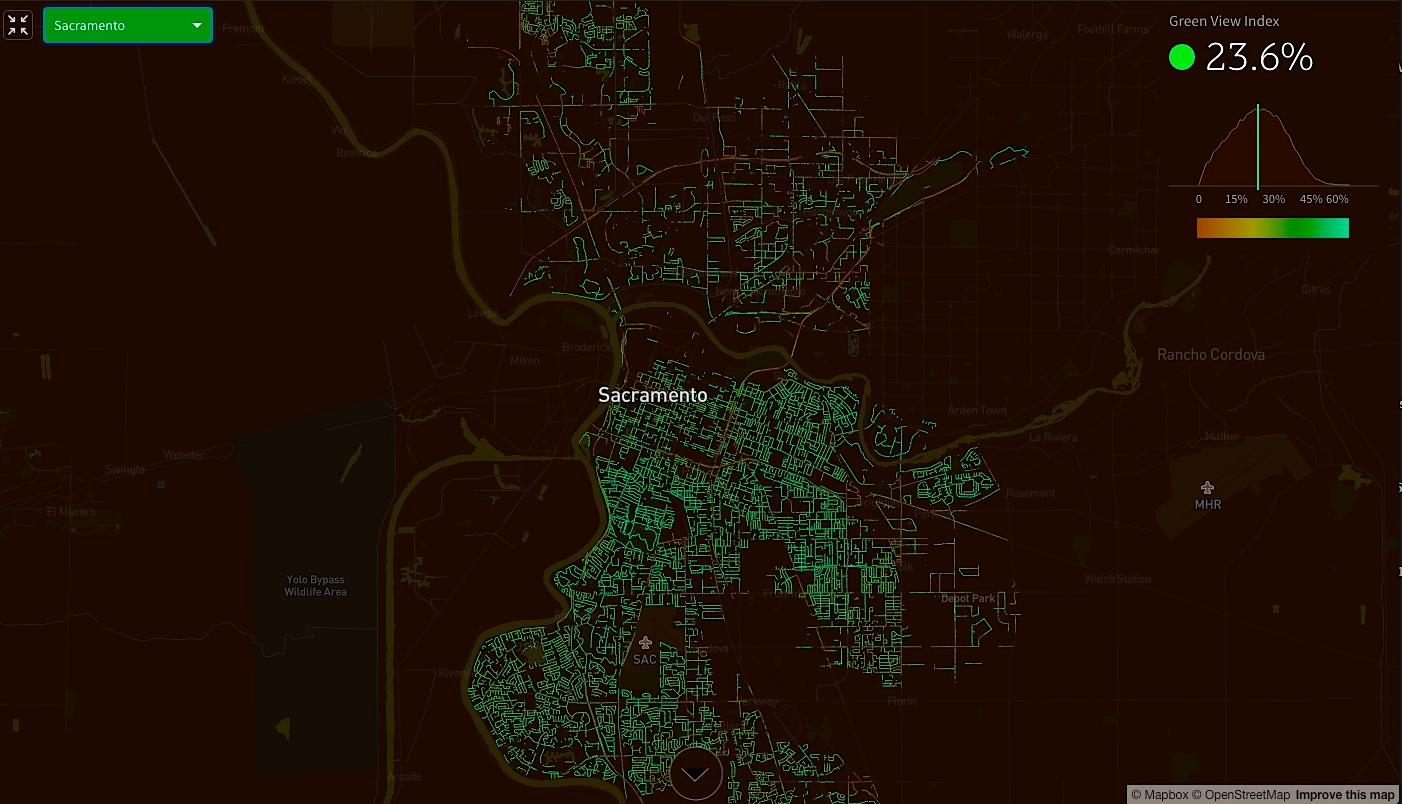
Sacramento, by Treepedia
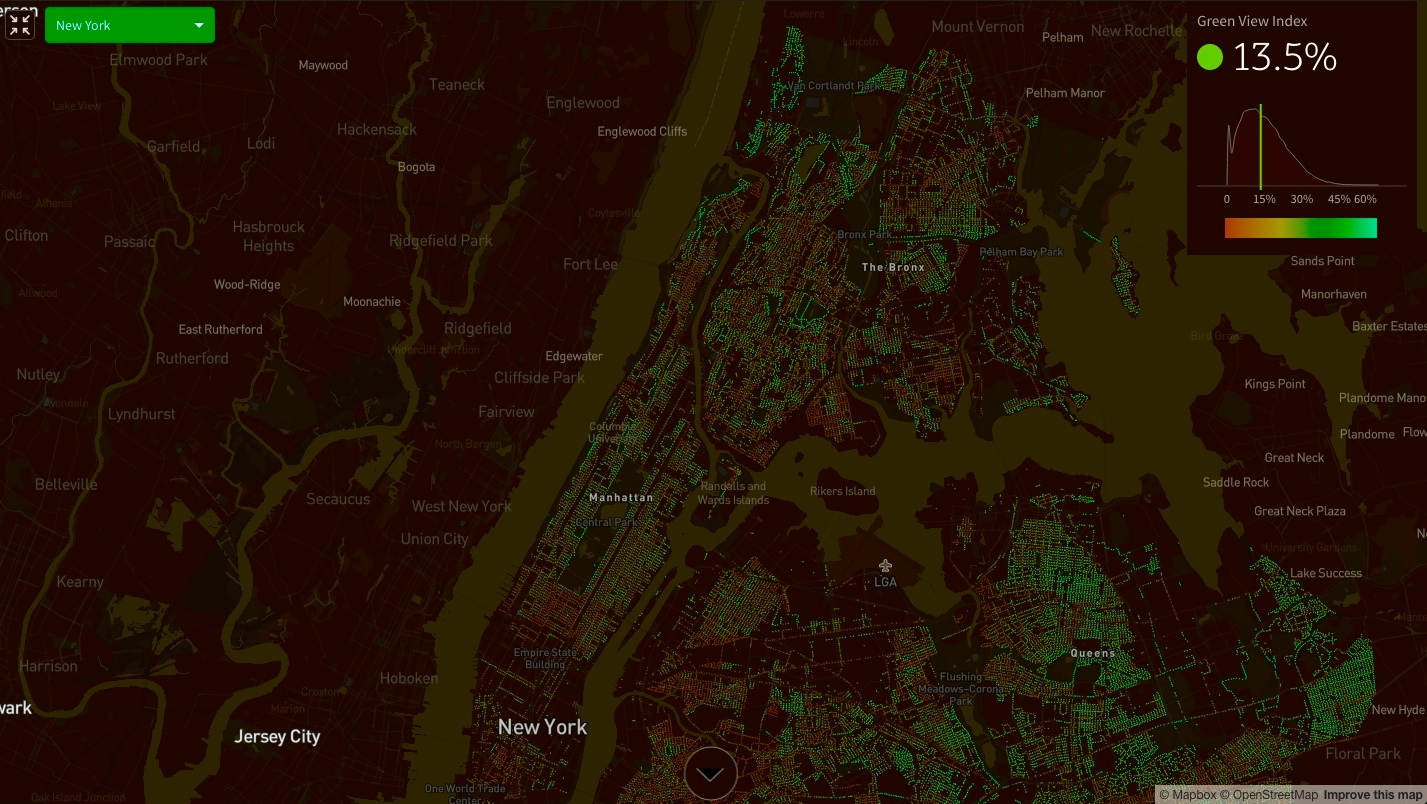
New York City, by Treepedia
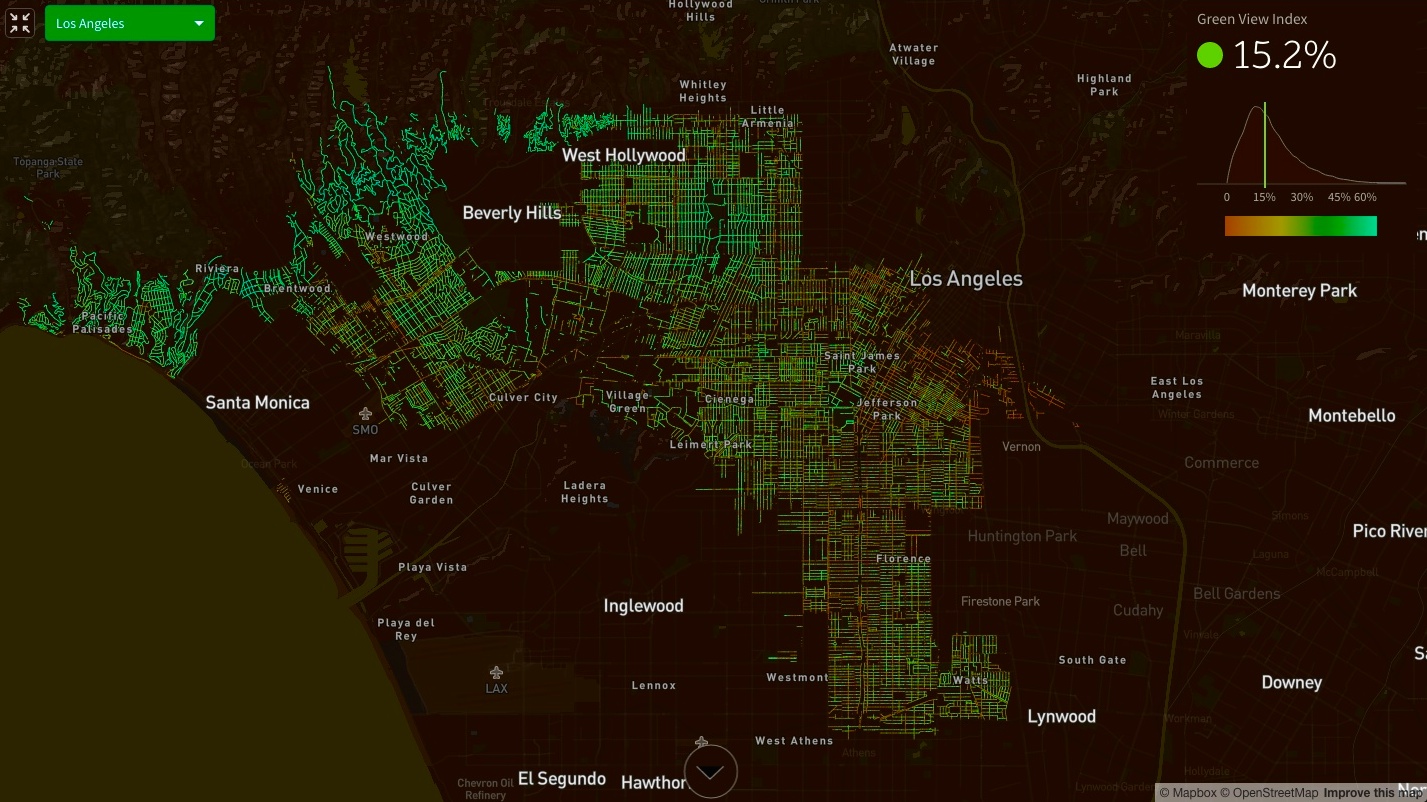
Los Angeles, by Treepedia
Do you think Seattle, Miami or Boston are greener? Check them out:

Seattle, by Treepedia
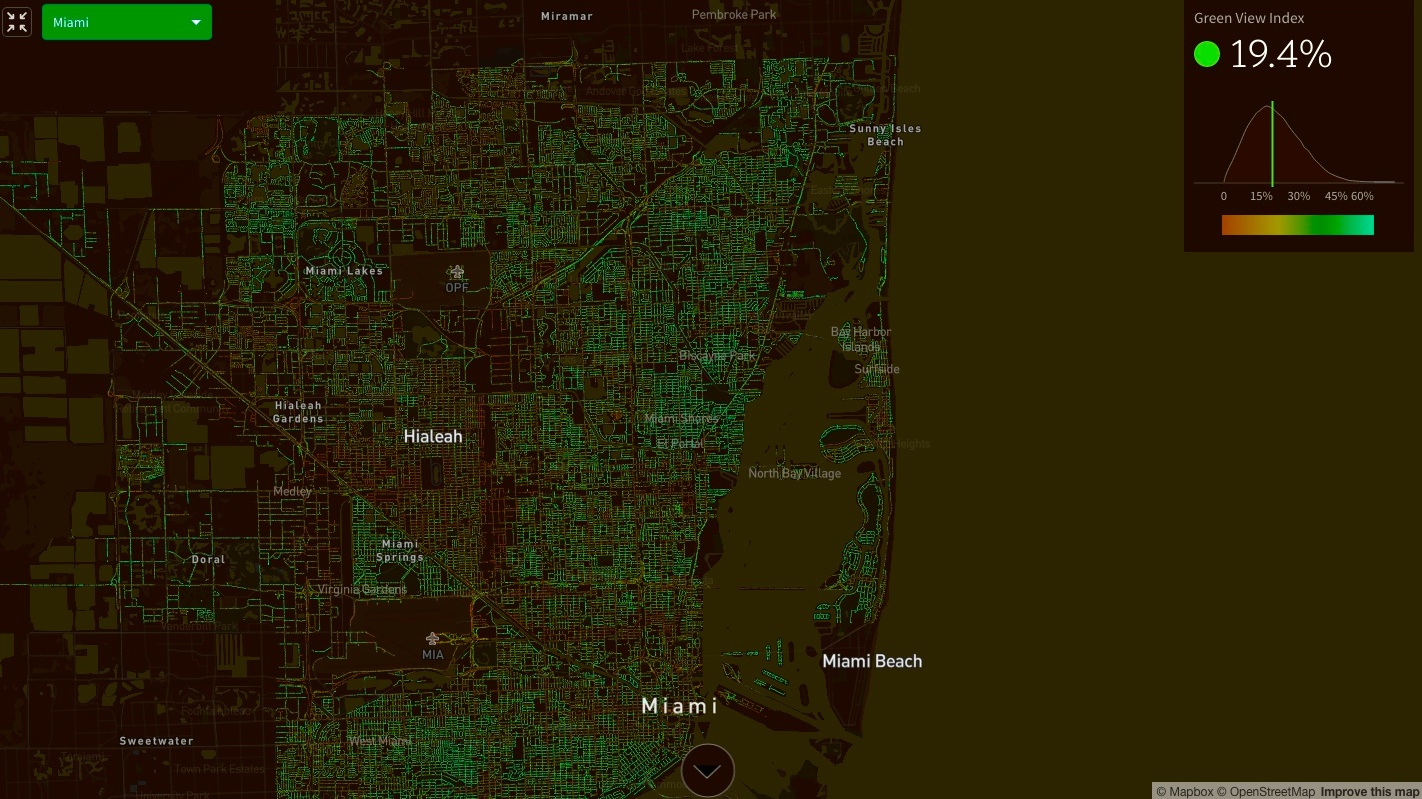
Miami, by Treepedia

Boston, by Treepedia
The greenest in Treepedia’s full list is Singapore (29.6%) and the one that has scored lowest is Paris (8.8%), which is also the most dense of the group: 21000 people per square kilometer! Bear in mind New York City “only” has 10831 people per square kilometer. Those who have lived in NYC or Paris know how difficult it is to keep one’s sanity living in tiny apartments and with no green areas around. The maps are not only beautiful to look at… they help us better understand the importance of vegetation in the cities we want to live in.
* * *
Treepedia is available at senseable.mit.edu/treepedia. It has been developed by The Senseable City Lab at the Massachusetts Institute of Technology (MIT), a multidisciplinary research group that studies the interface between cities, people, and technologies. Treepedia is carried out in partnership with the World Economic Forum’s Global Agenda Council on the Future of Cities and its Global Shapers Community. The team of researchers include Carlo Ratti (Director), Newsha Ghaeli (Project Lead), Wonyoung So (Web, Visualization), Xiaojiang Li (Green View Index Development) and Ian Seiferling (Analytics & Environment). For those interested in the science behind the project, the paper is here. ![]()