Photo: SafeGraph

Cell Phone Data Shows More Americans Are Defying Stay-at-Home Orders

News Maps + Infographics
by Eben Diskin May 4, 2020

Public opinion is still out on whether we’re comfortable with cell phone data companies tracking our locations, but nonetheless, some of that data can prove highly informative — particularly in times like these.

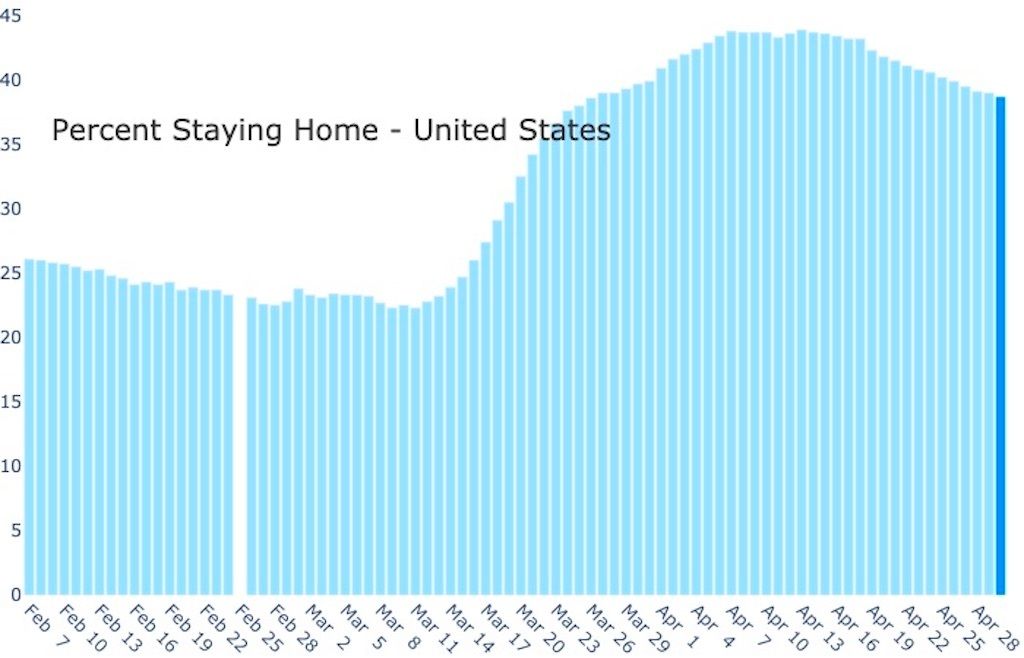
After Unacast released a Social Distancing Scoreboard in March, using mobile GPS data to show who was social distancing and who wasn’t, new location-based data is showing that recently, Americans have been defying the stay-at-home orders. The results, compiled by mobile phone location data company SafeGraph, show that people have been moving around in far greater numbers since late April, as states around the country prepare to relax social distancing guidelines.

SafeGraph used data from around 18 million mobile phones to arrive at its results. It’s important to note that while the data shows how many people traveled from their places of residence, it does not reveal where they went or how they chose to spend that time away from home.

percentage of Americans staying at home

Photo: SafeGraph

On Easter, April 12, it found that 50 percent of tracked mobile phones stayed home, and that number has only decreased in the days following. The most recent numbers show that under 40 percent of people stayed home on April 27.

You can use SafeGraph’s interactive map tool to search by state or country and see how your area is doing. From the chart, you can see that April 13 was the height of the nation’s stay-at-home determination, with an average of 44 percent of Americans abiding by the restrictions. That number has since dropped to 38 percent on April 30.

But that doesn’t mean all states or counties are created equal. Looking at the county-by-county percentage breakdown, we can see the two extremes. In Queens, New York, 56.7 percent of people were still staying home as of April 30, while only 15.7 percent of residents in Loving, Texas, appeared to stay home on the same date.

Map percentages of Americans staying at home on April 13

On April 13, 2020 (Photo: SafeGraph)

map percentages of Americans staying at home on April 30

On April 30, 2020 (Photo: SafeGraph)

Comparing these late April numbers to April 13, the apparent height of social distancing in the US, there’s an interesting shift in the percentages. Queens was still the best at social distancing with 61.6 percent of residents staying home, while Loving had 18.2 percent. Of course, stay-at-home orders are different in each state, and states like New York that are hit harder by COVID-19 will predictably have more people staying home than less densely affected states like Texas.

A tracker developed by the University of Maryland arrived at similar results. Sepehr Ghader, the senior researcher on the project, told NPR that he believes social distancing fatigue is setting in around the country. “It might be due to people getting tired of staying at home,” he said, “or it could be due to people reacting to the news that states are being reopened. We can’t really say why this trend is happening…but we can certainly see the trend in the decrease of social distancing metrics.”

Discover Matador

Save Bookmark

We use cookies for analytics tracking and advertising from our partners.

For more information read our privacy policy.