If you want to get the most out of this year’s fall, this map is the perfect tool for planning your foliage-themed US trip. The color-coded map, developed by SmokyMountains.com, shows how leaves progressively change color, from the end of August to the middle of November, across each region of the country. And as you can tell from experimenting with the slider, timing is crucial when it comes to catching the season’s most vibrant foliage.
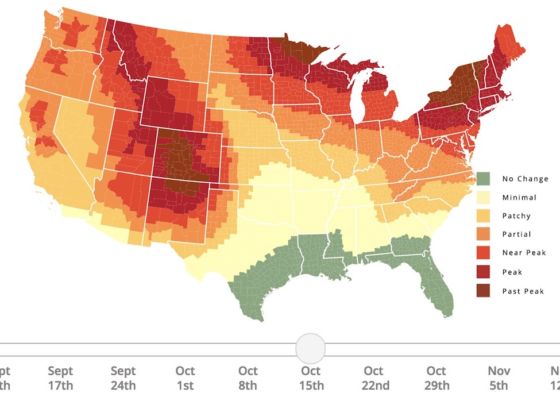
Photo: Smoky Mountains
This Fall Foliage Prediction Map Is a Leaf-Peeper’s Best Friend
The map works through the use of a complex algorithm, which analyzes data from such sources as the National Oceanic and Atmospheric Administration (NOAA) historical temperatures, NOAA historical precipitation, NOAA forecast temperatures, NOAA forecast precipitation, historical leaf peak trend, and peak observation trends. This data allows the map program to forecast foliage peaks county-by-county with astonishing accuracy.
While the map is generally accurate, the biggest factor that could cause deviations from the foliage predictions is unexpected rainfall. Extreme rainfall has the ability to alter peak foliage dates, and even the color of the leaves themselves, so let’s hope for dry weather. ![]()